Probability-Based Manipulability Score Using Forward-Kinematics Voxelization

CopyrightⓒKROS
Abstract
This paper proposes the Probability-Based Manipulability Score (PBMS), a new metric for comparing articulated manipulators with different degrees of freedom. PBMS employs a log-scaled score within a voxelized workspace to capture the effects of kinematic redundancy. This approach overcomes the upper-bound limitations of conventional indicators, which constrain performance indices even as the degrees of freedom increase, thereby enabling comparison across manipulators with different configurations. To validate the proposed method, simulations were conducted on three manipulators that share an identical workspace: a 4-DOF manipulator used as the reference model, another 4-DOF manipulator with a different joint arrangement and a 3-DOF manipulator. Additionally, motion-capture experiments were performed for each manipulator to measure the positions of the end-effector, and the experimental results were compared with the simulation outcomes. The results demonstrate that PBMS can effectively guide the task-specific design and evaluation of redundant manipulators.
Keywords:
Manipulability Index, Workspace Analysis1. Introduction
Numerous mechanisms and optimization strategies have been explored to improve the agility and precision of articulated manipulators, particularly humanoid robot arms[1,2]. To evaluate their task performance, two key aspects are typically considered: the workspace, representing the region that the end-effector can physically reach, and the manipulability, which describes dexterity within that space[3-6].
For articulated manipulators, a common approach to identifying the reachable workspace is to perform Monte Carlo sampling of joint configurations and compute the corresponding end-effector positions through forward kinematics[7,8]. This probabilistic method provides an intuitive spatial distribution, where regions with denser point clusters correspond to higher reachability probabilities. However, because low-reachability areas are sparsely sampled, this approach often fails to clearly delineate the exact workspace boundaries. To address this, non-uniform sampling strategies have been introduced. For instance, Peidró et al. proposed a method that first generates a seed workspace using a small number of samples and then expands into sparse regions through Gaussian growth to refine the boundary[9-11]. Although this approach enhances boundary accuracy, it compromises one of the key advantages of the Monte Carlo method, its probabilistic representation of spatial favorability, since the resulting point distribution no longer reflects the true likelihood of reachability.
In parallel, several methods have been proposed to quantify manipulability within the workspace. Two representative approaches are (1) Jacobian-based indices, which evaluate differential motion capability at each configuration, and (2) voxel-based reachability maps, which estimate the proportion of achievable positions and orientations via inverse kinematics[12-18]. The former, pioneered by Yoshikawa[13], defines the manipulability index as the square root of the determinant of the symmetric product of the Jacobian, , which represents the volume of the velocity ellipsoid at a given configuration. The latter, proposed by Zacharias as the capability map[15], captures both reachability and manipulability in a voxelized workspace, where reachability represents the ratio of attainable positions and manipulability indicates the ratio of achievable orientations within each voxel. While both metrics are widely used, they share a practical limitation: their values are constrained by upper bounds, Yoshikawa’s index by the product of singular values, and the capability map by a ratio bounded by one. As a result, the advantages of increased kinematic redundancy are not sufficiently reflected when comparing manipulators with different degrees of freedom.
To address these limitations, we propose the Probability-Based Manipulability Score (PBMS), a new performance index developed for relative comparison. PBMS estimates the spatial distribution of reachable end-effector positions by performing forward kinematics on randomly sampled joint configurations using the Monte Carlo method within a voxelized workspace. The resulting distribution enables a probability-based manipulability index that provides comparison across robots with different degrees of freedom. We validate the proposed PBMS through GPU-accelerated Monte Carlo simulations by comparing three manipulators that share an identical workspace: a 4-DOF reference manipulator, another 4-DOF manipulator with a different joint arrangement, and a 3-DOF manipulator. The performance of each manipulator is evaluated within the ISO cube, defined as the largest inscribed cube entirely contained in the manipulator’s workspace[19]. In addition, motion-capture experiments are conducted to measure the positions of the end-effector and to compare the experimental results with the simulation outcomes.
The remainder of this paper is organized as follows. Section 2 describes the computation process of the proposed Probability-Based Manipulability Score (PBMS). Section 3 presents a simulation-based comparative evaluation to demonstrate how PBMS can distinguish manipulators with different kinematic structures. Section 4 validates the proposed method through motion-capture experiments using a modular testbed, examining the consistency between simulation and physical measurements. Section 5 discusses the experimental limitations and insights derived from the results (Section 5.1), the robustness evaluation of PBMS under sparse sampling conditions (Section 5.2), and the extension of PBMS application to an actual humanoid robot case (Section 5.3). Finally, Section 6 concludes the paper with a summary of findings and future research directions.
2. Method
2.1 Calculation of PBMS
The end-effector position of a manipulator can be computed using forward kinematics. When computing forward kinematics with randomly sampled joint angles, positions that can be reached through a greater number of joint angle combinations tend to produce denser point clouds, indicating a higher probability of achieving diverse manipulator configurations and orientations. In a voxelized workspace, voxels with denser point clouds are more likely to reflect regions where diverse configurations and orientations can be achieved, suggesting higher potential performance.
When a sufficiently large number of joint configurations are randomly sampled, this distribution approximates the result of uniformly sampling each joint over its range. In this case, the total number of possible configurations grows exponentially with the number of joints, forming a set of points in the form of nD, where n is the number of sampled angles per joint and D is the number of joints. These points represent possible end-effector positions and are interpreted probabilistically. In this context, a sufficiently large sample size refers to the point at which further sampling no longer produces meaningful changes in the resulting distribution or PBMS value, indicating convergence of the Monte Carlo estimation[20].
Adding one joint increases the total number of configurations by a factor of n. If we assume that this increase is evenly distributed across all voxels, it becomes equivalent to multiplying the number of points in each voxel by n. Therefore, an n-fold increase in the number of points within a voxel can be interpreted as the performance gain resulting from one additional degree of freedom. This assumption enables the use of a logarithmic transformation to quantify relative performance differences between manipulators at each voxel in terms of degrees of freedom.
| (1) |
Let N = nD be the total number of sampled configurations. The base of the logarithm, a, is determined from N and the maximum score M defined by the user. It is chosen so that the increase in sample count associated with one additional degree of freedom, N(1/D), maps directly to the corresponding score increment M/D. This increment represents the score contribution of one degree of freedom. The maximum number of points observed in a voxel is denoted as Mc. The bias term k shifts the score range so that the voxel with Mc attains the user-defined maximum score M in (1). This shifting ensures that all scores are normalized to a common baseline, enabling fair comparison across manipulators with different degrees of freedom. Based on these definitions, the number of points C within a specific voxel is counted, and the corresponding score S is computed as shown in (1).
When PBMS is used to compare the potential performance of manipulators with different degrees of freedom, a reference manipulator is first selected to define the baseline sampling density. A manipulator with more degrees of freedom inherently possesses a larger configuration space and can achieve a greater variety of end-effector positions and orientations. However, if both manipulators are evaluated with the same number of sampled configurations, the higher-DOF manipulator cannot fully express this structural advantage because its larger configuration space becomes under-sampled. As a result, the performance differences arising from the degrees of freedom would not be properly reflected in the PBMS.
| (2) |
To address this issue, the number of samples for the test manipulator must be scaled according to its degrees of freedom so that the sampling density per joint dimension remains consistent with the reference manipulator. This adjustment is performed using (2), where Nref and Dref denote the sample count and degrees of freedom of the reference manipulator, while N and D correspond to the test manipulator. By scaling N according to (2), the PBMS computed from (1) appropriately captures the performance differences that originate from the manipulators’ kinematic redundancies rather than from unequal sampling densities.
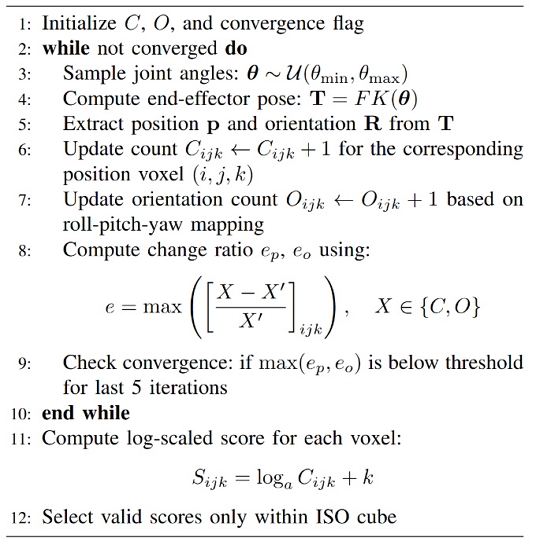
To ensure that the sample size is sufficiently large, sampling is performed iteratively in small batches, and convergence is monitored. In this evaluation, only the scores within the ISO cube, where most tasks are typically performed, are considered. A summary of this procedure is described in Algorithm 1.

PBMS computation Prcedure
Although the PBMS value in (1) is computed solely from the position-based count C, the sampling procedure also evaluates whether the range of feasible end-effector orientations has been sufficiently explored. A denser positional point cloud implicitly reflects a wider variety of achievable orientations, which is consistent with the notion of higher potential performance within a voxel. Therefore, orientation information is not used directly in the final PBMS score, but instead serves as a convergence criterion to prevent biased or insufficient angular coverage during sampling.
To evaluate convergence in orientation, it was assumed that each position voxel contains a corresponding orientation voxel to consider reachable orientation. Each orientation voxel is defined in a 3D space structured along the roll, pitch, and yaw axes, representing orientations for the corresponding position. At each iteration, the orientation is obtained from forward kinematics and mapped into this orientation voxel. Then, the number of reachable orientation voxel, which has any corresponding combination of roll, pitch, yaw angle for the given position, is counted. This number ranges from 1 to the cube of the number of divisions along each rotational axis. For instance, if each axis is divided into 10 intervals, the maximum number of reachable orientation voxels becomes 1,000. These bounds correspond to two extremes: a singular configuration such as a fully stretched manipulator with only one reachable orientation, and configurations where all orientations are accessible at a given position.
| (3) |
Convergence was evaluated for each voxel using a change ratio, defined as the relative change in results before and after each iteration. The change ratios corresponding to position and orientation, denoted as ep and eo, were calculated as shown in (3).
Here, C represents the number of points accumulated in each position voxel. O represents the numbers of reachable orientation voxels of orientation voxels for a given position voxel. C and O represent the updated values after the current iteration, while and are their corresponding values from the previous step. The indices i, j, k refer to the spatial dimensions x, y, z respectively. At each iteration, ep and eo, defined as the maximum change ratio across all position voxels, were calculated. The simulation was considered to be converged when ep and eo are below a certain threshold for five consecutive iterations.
3. Simulation
3.1 Comparison of PBMS
A simulation was conducted to compare three manipulators using the proposed PBMS. All manipulators share an identical workspace and were evaluated within a common ISO cube to ensure fair comparison. These manipulators were implemented on a modular testbed named the MAT (Modularized Arm Testbed), which allows reconfiguration of joint types and link arrangements to facilitate comparative analysis. The first manipulator, a 4-DOF model, was used as the reference structure. The second manipulator has the same 4-DOF but features a different joint arrangement to investigate the effect of kinematic configuration on manipulability. The third manipulator is a 3-DOF model, included to analyze the influence of kinematic redundancy on workspace distribution and PBMS values. The geometric configurations of the MAT used in this study are illustrated in [Fig. 1]. From left to right, the models correspond to the reference manipulator, the 4-DOF test manipulator, and the 3-DOF test manipulator. Each actuator is highlighted in blue to indicate the locations of the active joints, and the link dimensions and joint spacings shown in the figure were used consistently throughout the forward-kinematics simulations and workspace analyses. Joint limits were not applied in order to focus on the intrinsic kinematic characteristics of each configuration.
![[Fig. 1]](/xml/48726/JKROS_2026_v21n1_109_f001.jpg "[Fig. 1]")
CAD models of the MAT (Modularized Arm Testbed) manipulators used in this study. From left to right: reference manipulator, 4-DOF test manipulator, and 3-DOF test manipulator. Blue components represent actuators, and the annotated dimensions (in mm) indicate the joint-to-joint spacing applied in the PBMS simulations.
To visualize the spatial distribution of scores, the computed PBMS values were mapped to each voxel in the workspace, as illustrated in [Fig. 2]. After PBMS computation, the workspace was color-coded voxel by voxel according to the relative score of each region. To facilitate interpretation, three transverse planes and one sagittal plane were used to slice the 3D space, and the voxel colors corresponding to each plane were projected onto 2D plots. In this simulation, the transverse planes were defined at z = 0 mm, 120 mm, and 240 mm corresponding to the shoulder, half-elbow and elbow levels, respectively, while the sagittal plane was defined at x = 0 mm. Each 2D plot in [Fig. 3] shows the score distribution of voxels on these planes for each manipulator. The shoulder plane corresponds to the position of the second joint, where the axes of the first, second, and third joints intersect in the reference structure. The elbow plane represents the end face of the ISO cube, approximately corresponding to the distance from the base to the elbow joint, while the half-elbow plane is defined at half of this distance. The corresponding heights of the shoulder, half-elbow, and elbow planes were set to 0 mm, 120 mm, and 240 mm, respectively, measured from the origin of the base frame, which is defined as the origin with coordinates, x = 0, y = 0 and z = 0. The scores for three manipulators were computed per voxel using equation (1). Since the 3-DOF manipulator had different degrees of freedom, the number of samples was adjusted to account for a one-degree-of-freedom difference. The maximum score of the reference manipulator was set to 100. Accordingly, the score difference corresponding to the effect of one degree of freedom was calculated as 25.0 points, derived by dividing the user-defined maximum score M by the number of degrees of freedom D.
![[Fig. 2]](/xml/48726/JKROS_2026_v21n1_109_f002.jpg "[Fig. 2]")
Illustration of voxel color distribution and slicing plane used for visualization of PBMS. Three transverse planes correspond to the shoulder, half elbow and elbow plane, respectively.
![[Fig. 3]](/xml/48726/JKROS_2026_v21n1_109_f003.jpg "[Fig. 3]")
Relative PBMS scores for each manipulator with respect to reference structure: (a) 4-DOF manipulator with different joint arrangement, and (b) 3-DOF manipulator. The heights of the transverse planes at the shoulder, half elbow and elbow were set to 0 mm, 120 mm, and 240 mm, respectively, measured from the base frame.
The evaluation space was defined as a bounding cube with sides of 1,100 mm, divided into 40 intervals along each axis to produce position voxels of 27.5 mm. However, scoring was performed only within the ISO cube, the largest inscribed cube fully enclosed within the manipulator’s workspace. In this case, the ISO cube had a side length corresponding to 18 intervals, or 495 mm. For the orientation space, each rotational axis was divided into 10 intervals, resulting in orientation voxels with a resolution of 36 degrees per axis. [Fig. 3] presents the relative PBMS scores for each manipulator compared to the reference structure. Two comparison cases are shown: (a) a 4-DOF manipulator with a different joint arrangement and (b) a 3-DOF manipulator. Each subplot visualizes the voxel-wise score differences using a color map across the same representative planes. The delta score indicates how much higher or lower each manipulator scores relative to the reference at each voxel. The color map is normalized based on the absolute score difference between each test manipulator and the reference. Purple regions represent areas where the relative score difference is negative, while orange regions indicate positive score differences. Voxels with values close to zero are shown in gray, representing regions where the test and reference manipulators exhibit nearly identical PBMS values. In this color scheme, higher color intensity corresponds to larger deviations in magnitude from the reference score, regardless of sign. As shown in [Fig. 3(a)], the 4-DOF test manipulator exhibited score distributions that were comparable to or slightly lower than the ideal value in the vicinity of the base frame. At the shoulder plane, regions within approximately 124 mm from the base frame appeared in gray, indicating that the scores were close to the expected value under the condition of equal degrees of freedom and therefore did not represent a significant loss. At the half-elbow plane, regions within about 80 mm from the base frame showed a similar pattern of purple or gray coloring, suggesting only a small deviation from the reference manipulator. In contrast, at the elbow plane, the overall distribution was visualized in orange or gray, implying slightly higher scores than the reference and indicating that performance differences became more noticeable toward the outer workspace.
The sagittal-plane plots also reveal that this pattern is distributed in a nearly spherical manner. The purple regions are mainly observed around the intersection point of the first through third joint axes in the shoulder area, implying that the score degradation of the test manipulator occurs near this region of the reference structure. In contrast, regions closer to the outer boundary of the workspace, particularly near the faces of the ISO cube, exhibit higher score distributions, indicating that the test manipulator performs relatively better toward the limits of its reachable workspace.
For the 3-DOF test manipulator, as illustrated in [Fig. 3(b)], the overall score distribution appeared predominantly in purple across all planes, indicating that most voxels exhibited lower PBMS values than the reference. Because this color corresponds to the expected decrease of approximately 25 points, the results suggest that the 3-DOF manipulator is generally affected by the degree-of-freedom difference throughout the workspace. The color distribution was mainly organized along the z-axis, rather than showing clear variations between transverse planes. Voxels located close to the z-axis appeared more grayish, indicating regions where the score difference approached near zero. This occurs because, when the reference manipulator aligns its first and third joint axes parallel to the z-axis, a local singularity arises, effectively reducing one degree of freedom. Consequently, the 3-DOF manipulator exhibited similar performance to the reference in this configuration.
These results suggest that, in the comparison between the two 4-DOF manipulators, the reference structure is more suitable for tasks near the base where the joint axes intersect, while the 4-DOF test manipulator performs better near the edges of the ISO cube, particularly around singularity-like configurations. The 3-DOF manipulator, on the other hand, shows relatively favorable score near the z-axis, where the singularity of the reference structure occurs. Nevertheless, both simulations indicate that the overall score variations remain small within the workspace when interpreted in light of the expected reduction due to the configuration and degree-of-freedom difference.
3.2 Convergence Criteria
[Fig. 4] presents the change ratio ep and eo computed at each iteration during the random sampling of end-effector positions and orientations, as performed using the equation (1) and (3) described in Algorithm 1. In each iteration, 5,000,000 random samples were used, and the threshold for determining convergence was set to 1%. Because the manipulators used in this study have three and four degrees of freedom, convergence was evaluated based solely on the position change ratio ep. In the figure, the blue, green, and red lines correspond to the reference manipulator, the 4-DOF test manipulator, and the 3-DOF test manipulator, respectively. A total of 27 iterations were performed until convergence was achieved, resulting in 135,000,000 samples being used in the simulation. The simulation was conducted on an NVIDIA GeForce RTX 3060 GPU and completed in approximately 2 minutes.
![[Fig. 4]](/xml/48726/JKROS_2026_v21n1_109_f004.jpg "[Fig. 4]")
Change ratio ep and eo across iterations.
4. Experiment
4.1 Experimental setup
The motion capture experiment was conducted using the modular testbed MAT to compare the tendencies between the simulation and the actual measurements, as show in [Fig. 5]. The optical motion-capture system consisted of VICON T160 cameras (16 MP resolution, 120 fps at full resolution) operating under Vicon Nexus software. The system employed Vicon’s proprietary gray-scale centroid-fitting algorithm for precise 2D tracking and real-time 3D reconstruction. Marker positions were captured with a typical spatial accuracy of approximately ±0.5 mm within the calibrated workspace. The MAT testbed was fabricated via 3D printing using PLA reinforced with carbon fiber (PLA-CF) to achieve a lightweight yet rigid structure. Actuation was provided by DYNAMIXEL PRO servos (H54-200-S500-R and H54-100-S500-R) to ensure accurate and repeatable motion across configurations.
![[Fig. 5]](/xml/48726/JKROS_2026_v21n1_109_f005.jpg "[Fig. 5]")
Manufactured model of MAT and experimental setup for motion capture. The marker at end-effector is tracked through the VICON cameras.
Because of the intrinsic limitations of the motion-capture process, it was not feasible to achieve the same large-scale sampling as in the simulation. Therefore, the experiment focused on comparing the overall tendencies under equivalent conditions, even though the end-effector could not reach the interior of the ISO cube. To explore a wide range of joint configurations within a limited time, rough joint limits of [-90°, ~90°] were assigned to all joints, and a relatively high joint velocity of approximately 15–25 deg/s was applied. Each configuration was measured for 300 seconds at 100 Hz, yielding a total of 30,000 samples of end-effector positions per configuration.
To ensure sufficient variation among joint combinations, each joint was actuated using a triangular-wave motion pattern with different periods. The periods were chosen such that their least common multiple exceeded the total measurement duration, preventing repetition of joint combinations within a single trial, as summarized in [Table 1]. These settings allowed the experiment to qualitatively replicate the sampling tendencies observed in the simulation, while maintaining comparable kinematic coverage within the reachable workspace.
Experimental setup for each joint
4.2 Experimental Results and Analysis
To compare the tendencies between the simulation and the physical experiment, the Probability-Based Manipulability Score (PBMS) was computed within voxels of identical size. [Fig. 6] shows the PBMS results obtained from the motion-capture data of the MAT testbed. The motion trajectories recorded during the experiment formed a thin spherical shell centered around the base frame, representing the reachable surface swept by the end-effector. As in the simulation, the score distributions were analyzed on two transverse planes, the shoulder and the elbow heights, and on an additional upper plane (360 mm height) between the elbow level and the workspace boundary, where sufficient data were available.
![[Fig. 6]](/xml/48726/JKROS_2026_v21n1_109_f006.jpg "[Fig. 6]")
Relative PBMS scores for each manipulator with respect to reference structure from motion capture data: (a) 4-DOF manipulator with different joint arrangement, and (b) 3-DOF manipulator. The heights of the transverse planes at the shoulder, elbow and upper were set to 0 mm, 240 mm, and 360 mm, respectively, measured from the base frame.
The color map used for visualizing PBMS differences followed the same convention as in the simulation: orange indicates higher scores, purple indicates lower scores relative to the reference manipulator, and gray represents smaller deviations from the expected value. Although the motion covered a broad range of reachable postures, the plots exhibit asymmetric and sparse distributions because of the limited sample count relative to the dense voxel grid and the restricted joint-limit range.
For the 4-DOF test manipulator, the simulation results in [Fig. 3] showed that the score distribution tended to appear purple near the origin, gradually shifting toward orange near the ISO-cube boundaries, and finally turning gray again near the cube’s corner regions. The experimental results in [Fig. 6] demonstrate a similar trend: as the end-effector approaches the outer faces of the workspace, orange-colored regions become more prevalent, while purple areas emerge near the corners corresponding to the workspace boundaries.
For the 3-DOF test manipulator, the simulation indicated that the reference structure’s z-axis alignment produced a local singularity, yielding relatively advantageous scores in the surrounding region. This effect appeared as an hourglass-shaped distribution in the sagittal plane, with predominantly light-purple regions elsewhere. The experimental results in [Fig. 6] show a consistent tendency: orange-colored regions increasingly appear near the z-axis as the height increases toward the workspace boundary, which is particularly evident in the sagittal-plane plots where orange zones cluster along the central vertical axis.
[Fig. 7] presents snapshots of the experiment captured every 4 seconds, illustrating the motion of the MAT throughout the motion-capture trial. The motion began from a fully stretched configuration along the z-axis and proceeded with cyclic joint rotations following the periods and angular velocities listed in [Table 1]. These snapshots confirm that the MAT swept through a wide variety of trajectories within the reachable workspace during the experiment. Overall, the experimental PBMS distributions exhibited partially consistent spatial tendencies with the simulation results, particularly within the regions frequently reached by the end-effector.
![[Fig. 7]](/xml/48726/JKROS_2026_v21n1_109_f007.jpg "[Fig. 7]")
Sequential snapshots of the MAT obtained every 4 s using the motion-capture system. Starting from a fully stretched configuration along the z-axis, each joint rotated with the predefined periods and angular velocities listed in [Table 1].
5. Discussion
5.1 Experimental Limitations and Insights
Because only 30,000 end-effector samples were available while the workspace was discretized into 403 = 64,000 voxels, many voxels were left unsampled, particularly those located near the workspace boundaries. Consequently, quantitative comparison was feasible only in frequently visited regions. Furthermore, due to the joint-limit constraints in the experimental setup, none of the configurations reached the ISO cube; thus, the comparison focused on the overall spatial tendencies within the reachable workspace rather than complete volumetric coverage.
Despite these limitations, the experiment successfully reproduced the primary spatial tendencies observed in the simulation. The consistent PBMS distributions within the densely visited regions indicate that the proposed metric remains robust even under sparse sampling and restricted motion ranges. This result suggests that PBMS can serve as a reliable indicator for real-world manipulators where exhaustive sampling is impractical.
The experimental sparsity also reflects an inherent property of probability-based evaluations: local probability distributions can approximate global manipulability trends when the sampling diversity is maintained. Therefore, PBMS provides a scalable framework for both high-fidelity simulation and physical validation without requiring complete coverage of the configuration space. Future work will aim to enhance the experimental setup by expanding joint motion ranges, integrating end-effector orientation tracking, and increasing the sampling rate to improve volumetric coverage. The modular design of the MAT also allows further experiments with varied link geometries and actuation schemes, which will help generalize the applicability of PBMS to different manipulator types and redundancy levels.
5.2 Sparse Sampling Robustness Analysis
To determine how reliably the PBMS captures workspace-level tendencies under limited sampling, as observed in Section 5.1, additional simulations were conducted using significantly fewer samples than the fully converged case (135M samples). This analysis also identifies the approximate sampling threshold at which meaningful spatial trends begin to degrade. Five sampling conditions were tested: 5M, 500K, 50K, 30K (matching the MAT experiment), and 5K samples. For each case, the resulting PBMS distribution was compared against the converged reference using three criteria: RMSE (Root Mean Squared Error), Spearman’s rank correlation coefficient[21], and Kendall’s rank correlation coefficient[22].
RMSE was used to quantify the magnitude of numerical deviation from the fully converged PBMS distribution. Because PBMS is fundamentally a voxel-wise probability-based metric, RMSE provides a direct measure of how much each voxel’s estimated score drifts as the sample size becomes sparse.
| (4) |
| (5) |
Spearman’s rank correlation coefficient was used to evaluate whether the global monotonic trend of voxel-wise PBMS scores was preserved under reduced sampling density. As expressed in (4), Spearman’s coefficient computes the correlation between the rank-transformed vectors of the reference PBMS distribution X and the sparse-sampled distribution Y, where R(X) and R(Y) denote their respective rank-transformed values. The term is the covariance between the rank vectors, while σR(X) and σR(Y) represent their standard deviations. A value close to 1 indicates that the relative ordering of voxel scores is largely maintained.
Kendall’s rank correlation coefficient was additionally evaluated to quantify the stability of pairwise voxel ordering. As shown in (5), Kendall’s τ is defined using the number of concordant pairs C and discordant pairs D among all possible voxel pairs. Because τ directly measures the proportion of voxel pairs whose ordering changes between the two PBMS distributions, it serves as a sensitive indicator of local ranking consistency. Together, Spearman’s and Kendall’s coefficients provide complementary insights into the trend preservation and ordering robustness of PBMS under sparse sampling. The results of these analyses are summarized in [Table 2].
Robustness evaluation of PBMS under sparse sampling conditions. RMSE quantifies numerical deviation from the fully converged distribution (135M samples), while Spearman’s and Kendall’s rank correlation coefficients measure global trend preservation and voxel-wise ordering consistency, respectively.
Spearman’s rank correlation coefficient remains above 0.9 for sampling sizes down to 500K, indicating that the overall monotonic trend of voxel-wise PBMS scores is largely maintained. Kendall’s coefficient at 500K is 0.779, implying that approximately 11% of voxel pairs exhibit discordant ordering. Because Kendall’s metric is more sensitive to local ranking inconsistencies, this value suggests that most ranking changes occur among voxels with similar scores and therefore do not significantly distort the global spatial tendency.
Both correlation metrics exhibit a sharp decline at around 50K samples. This indicates that, below this threshold, ranking inconsistencies arise across wide regions of the workspace rather than being confined to locally similar voxels, marking the onset of structural breakdown in the PBMS trend. At 5K samples, Spearman’s coefficient drops to 0.333, implying that almost no meaningful spatial tendency remains.
Overall, these results indicate that meaningful trend preservation empirically requires a sampling size on the order of roughly ten times the number of voxels within the ISO cube. RMSE increases gradually as the sampling size decreases, reflecting greater deviation from the converged distribution. Moreover, smaller sample counts reduce the logarithmic base a in (1), lowering the effective score resolution and amplifying numerical discrepancies in the PBMS values.
5.3 Extension to Real-Robot Evaluation
To further validate the applicability of PBMS to real robotic systems, a simulation was conducted using the full-size humanoid robot TOCABI[23] and a corresponding 7-DOF test manipulator. [Table 3] summarizes the Denavit–Hartenberg parameters of both manipulators. The test manipulator was derived by removing the shoulder yaw joint (the 4th joint) from TOCABI’s arm to investigate the effect of one fewer degree of freedom. To compensate for payload differences, the link lengths were slightly modified compared to the reference structure.
Denavit–Hartenberg (DH) parameters of two single arms: (a) test manipulator, (b) reference manipulator (TOCABI arm)
[Fig. 8] presents the spatial distribution of PBMS for both manipulators. The color map was based on an expected reduction of 12.5 points, corresponding to the difference of one degree of freedom: orange represents higher scores, purple indicates lower scores, and white denotes nearly equivalent values. Transverse planes correspond to the shoulder, chest, and waist levels, positioned at 66 mm, –104 mm, and –274 mm, respectively, relative to the base frame.
![[Fig. 8]](/xml/48726/JKROS_2026_v21n1_109_f008.jpg "[Fig. 8]")
Relative PBMS scores for test manipulator with respect to humanoid robot TOCABI. The heights of the transverse planes at the shoulder, chest, and waist height were set to 66 mm, -104 mm, and -274 mm respectively, measure from the base frame.
As shown in [Fig. 8], the test manipulator exhibited slightly higher or comparable scores within approximately 50 mm of the base across all planes, represented by orange or white regions. In contrast, purple regions appeared between 50 mm and 250 mm at shoulder height, indicating reduced manipulability near the torso. At farther distances (250–400 mm), orange regions became dominant, suggesting improved performance in the arm-extended postures. The sagittal-plane visualization revealed that these regions formed a nearly spherical distribution. Notably, purple zones concentrated near the intersection of joints 2 through 4 in the reference manipulator, implying that the score degradation primarily occurs near the shoulder joint.
These findings demonstrate that the proposed PBMS can effectively distinguish the spatial advantages and disadvantages between manipulators with different kinematic structures, even when applied to a full-scale humanoid robot. This confirms the metric’s potential for practical evaluation and design optimization of redundant manipulators in real-world robotic systems.
6. Conclusion
In this paper, we proposed a new index called the Probability-Based Manipulability Score (PBMS), which enables relative evaluation of manipulability for articulated manipulators, including humanoid robot arms. Since the effect of kinematic redundancy is directly considered, PBMS allows meaningful comparison between redundant manipulators with different kinematic structures. Based on the simulation results, the proposed metric successfully identified the regions where each manipulator configuration, whether having the same or different degrees of freedom, was advantageous or disadvantageous within the workspace. The expected score difference derived from the difference in degrees of freedom provided a consistent basis for evaluating the relative impact of redundancy. Furthermore, motion capture experiments conducted using the modular testbed validated the feasibility of PBMS in real world conditions, showing partially consistent spatial tendencies with the simulation results within the reachable workspace. These findings demonstrate that PBMS can effectively bridge simulation based analysis and experimental validation. In future work, PBMS will be used to optimize robot configurations, such as the number of joints and link lengths, not only for task-specific performance in single manipulators, but also to improve coordination and coverage in dual-arm tasks.
Acknowledgments
This work was supported by the National Research Foundation of Korea (NRF) grant funded by the Korea government (MSIT) (No. RS-2024-00461583).
References
-
Y. Wang, W. Li, S. Togo, H. Yokoi, and Y. Jiang, “Survey on main drive methods used in humanoid robotic upper limbs,” Cyborg and Bionic Systems, vol. 2021, no. 9817487, Jun., 2021.
[https://doi.org/10.34133/2021/9817487]

-
L. Wang, J. Wu, and D. Tang, “Research on workspace of manipulator with complicated constraints,” 2008 7th World Congress on Intelligent Control and Automation, Chongqing, China, pp. 995-999, 2008.
[https://doi.org/10.1109/WCICA.2008.4593056]
-
Y. Guan, K. Yokoi, and X. Zhang, “Numerical methods for reachable space generation of humanoid robots,” The International Journal of Robotics Research, vol. 27, no. 8, Aug., 2008.
[https://doi.org/10.1177/0278364908095142]
-
Y. Cao, K. Lu, X. Li, and Y. Zang, “Accurate numerical methods for computing 2D and 3D robot workspace,” International Journal of Advanced Robotic Systems, vol. 8, no. 6, p. 76, Jan., 2011.
[https://doi.org/10.5772/45686]
-
P. Jauer, I. Kuhlemann, F. Ernst, and A. Schweikard, “GPU-based real-time 3D workspace generation of arbitrary serial manipulators,” 2016 2nd International Conference on Control, Automation and Robotics (ICCAR), Hong Kong, China, pp. 56-61, 2016.
[https://doi.org/10.1109/ICCAR.2016.7486698]
-
D. Zhang, F. Cursi, and G.-Z. Yang, “Wsrender: A workspace analysis and visualization toolbox for robotic manipulator design and verification,” IEEE Robotics and Automation Letters, vol. 4, no. 4, p. 3836-3843, Jul., 2019.
[https://doi.org/10.1109/LRA.2019.2929986]
-
Z.-C. Du, G.-Y Ouyang, J. Xue, and Y.-B. Yao, “A review on kinematic, workspace, trajectory planning and path planning of hyper-redundant manipulators,” 2020 10th Institute of Electrical and Electronics Engineers International Conference on Cyber Technology in Automation, Control, and Intelligent Systems (CYBER), Xi’an, China, pp. 444-449, 2020.
[https://doi.org/10.1109/CYBER50695.2020.9279171]
-
D. G. Alciatore and C.-C. D. Ng, “Determining manipulator workspace boundaries using the Monte Carlo method and least squares segmentation,” International design engineering technical conferences and computers and information in engineering conference, Minneapolis, MN, USA, pp.141-146, Sep., 1994.
[https://doi.org/10.1115/DETC1994-0316]
-
A. Peidro, O. Reinoso, A. Gil, J. M. Marin, and L. Paya, “An improved Monte Carlo method based on Gaussian growth to calculate the workspace of robots,” Engineering Applications of Artificial Intelligence, vol. 64, pp. 197-207, Sep., 2017.
[https://doi.org/10.1016/j.engappai.2017.06.009]
-
Z. Zhao, S. He, Y. Zhao, C. Xu, Q. Wu, and Z. Xu, “Workspace Analysis for a 9-DOF Hyper-redundant Manipulator Based on An Improved Monte Carlo Method and Voxel Algorithm,” 2018 IEEE International Conference on Mechatronics and Automation (ICMA), Changchun, China, pp. 637-642.
[https://doi.org/10.1109/ICMA.2018.8484734]
-
M. Aboelnasr, H. M. Bahaa, and O. Mokhiamar, “Novel use of the Monte-Carlo methods to visualize singularity configurations in serial manipulators,” Journal of Mechanical Engineering and Sciences, vol. 15, no. 2, pp. 7948-7963, Jun., 2021.
[https://doi.org/10.15282/jmes.15.2.2021.02.0627]
-
S. Patel and T. Sobh, “Manipulator performance measures-a comprehensive literature survey,” Journal of Intelligent and Robotic Systems, vol. 77, pp. 547-570, Mar., 2015.
[https://doi.org/10.1007/s10846-014-0024-y]
-
T. Yoshikawa, “Manipulability of robotic mechanisms,” The international journal of Robotics Research, vol. 4, no. 2, pp. 3-7, Jun., 1985.
[https://doi.org/10.1177/027836498500400201]
-
N. Vahrenkamp, T. Asfour, G. Metta, G. Sandini, and R. Dillmann, “Manipulability analysis,” 2012 IEEE-RAS 12th International Conference on Humanoid Robots (Humanoids 2012), Osaka, Japan, pp. 568-573.
[https://doi.org/10.1109/HUMANOIDS.2012.6651576]
-
F. Zacharias, C. Borst, S. Wolf, and G. Hirzinger, “The capability map: A tool to analyze robot arm workspaces,” International Journal of Humanoid Robotics, vol. 10, no. 04, p. 1350031, Dec., 2013.
[https://doi.org/10.1142/S021984361350031X]
-
F. Zacharias, C. Borst, and G. Hirzinger, “Capturing robot workspace structure: representing robot capabilities,” 2007 IEEE/RSJ International Conference on Intelligent Robots and Systems, San Diego, CA, USA, pp. 3229-3236, 2007.
[https://doi.org/10.1109/IROS.2007.4399105]
-
J.-Y. Park, P.-H. Chang, and J.-Y. Yang, “Task-oriented design of robot kinematics using the grid method,” Advanced robotics, vol. 17, no. 9, pp. 879-907, 2003.
[https://doi.org/10.1163/156855303770558679]
-
M. Badescu and C. Mavroidis, “New performance indices and workspace analysis of reconfigurable hyper-redundant robotic arms,” The International Journal of Robotics Research, vol. 23, no. 6, pp. 643-659, Jun., 2004.
[https://doi.org/10.1177/0278364904044406]
- Manipulating industrial robots – Performance criteria and related test methods, ISO 9283:1998, [Online], https://www.iso.org/standard/22244.html, , Accessed: Jun. 1, 2024.
-
H. Janssen, “Monte-Carlo based uncertainty analysis: Sampling efficiency and sampling convergence,” Reliability Engineering & System Safety, vol. 109, pp. 123-132, Jan., 2013.
[https://doi.org/10.1016/j.ress.2012.08.003]
-
C. Spearman, “The proof and measurement of association between two things,” The American Journal of Psychology, vol. 15, no. 1, 1904, pp. 72-101.
[https://doi.org/10.2307/1412159]
-
M. G. Kendall, “A new measure of rank correlation,” Biometrika, vol. 30, no.1/2, pp. 81-93, Jun., 1938.
[https://doi.org/10.1093/biomet/30.1-2.81]
-
M. Schwartz, J. Sim, J. Ahn, S. Hwang, Y. Lee, and J. Park, “Design of the humanoid robot TOCABI,” 2022 IEEE-RAS 21st International Conference on Humanoid Robots (Humanoids), Ginowan, Japan, pp. 322-329, 2022.
[https://doi.org/10.1109/Humanoids53995.2022.10000102]

2022 고려대학교 기계공학부(학사)
2022~현재 서울대학교 지능정보융합학과 석사, 박사 통합과정
관심분야: Power Transmission Mechanism, Humanoid design

2018 연세대학교 기계공학과(학사)
2021 서울대학교 지능정보융합학과(석사)
2021~현재 서울대학교 지능정보융합학과 박사과정
관심분야: Robotic joint, Harmonic drive

2019 고려대학교 기계공학부(학사)
2019~현재 서울대학교 지능정보융합학과 석사, 박사 통합과정
관심분야: Robotic Hand, Haptic

2022 서울대학교 건축공학 & 기계공학 복수전공(학사)
2022~현재 서울대학교 지능정보융합학과 석사, 박사 통합과정
관심분야: Haptic device

1995 서울대학교 항공우주공학과 (공학사)
1997 서울대학교 항공우주공학과(공학석사)
2006 Stanford University Aero/Astro. (공학박사)
2009~현재 서울대학교 융합과학기술대학원 교수
관심분야: Robot-environment Interaction, Multi Contact Control, Whole body Control